
Countries

Croatia

Denmark

France

Germany

Italy

Netherlands

Sweden
Developed by


REWARDHeat project scenario interface.
Cost
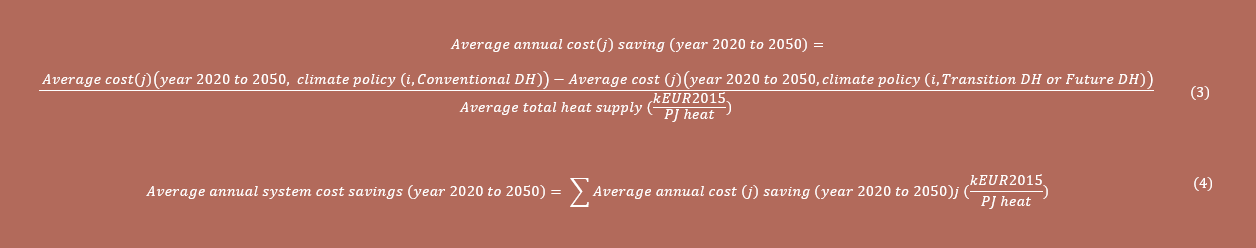
The model calculates total system cost discounted to 2015 as well as undiscounted variable costs (including energy flow cost, activity cost and taxes and subsidies), fixed operation and maintenance, and capital costs for each demo-city and each model year. From the model results, average annual system cost savings for each demo-city is calculated based on equations (3) and (4) where: “i” is either WEO-SD or WEO-NP “j”: variable cost, fixed operation and maintenance cost or capital costs
If you are ready, you can close this window and start exploring.
Average annual cost changes 2020-2050 Croatia
Average annual cost changes 2020-2050 Croatia
This project has received funding from the European Union’s Horizon 2020 research and innovation programme under grant agreement N. 857811.
The content of this website reflects only the author’s view only and the European Commission is not responsible for any use that may be made of the information it contains.